Strike Zone Quirks: Umpire Patterns and Their Sway Over Baseball Totals in League Play
Written by Eden Washington · Jun 8, 2026
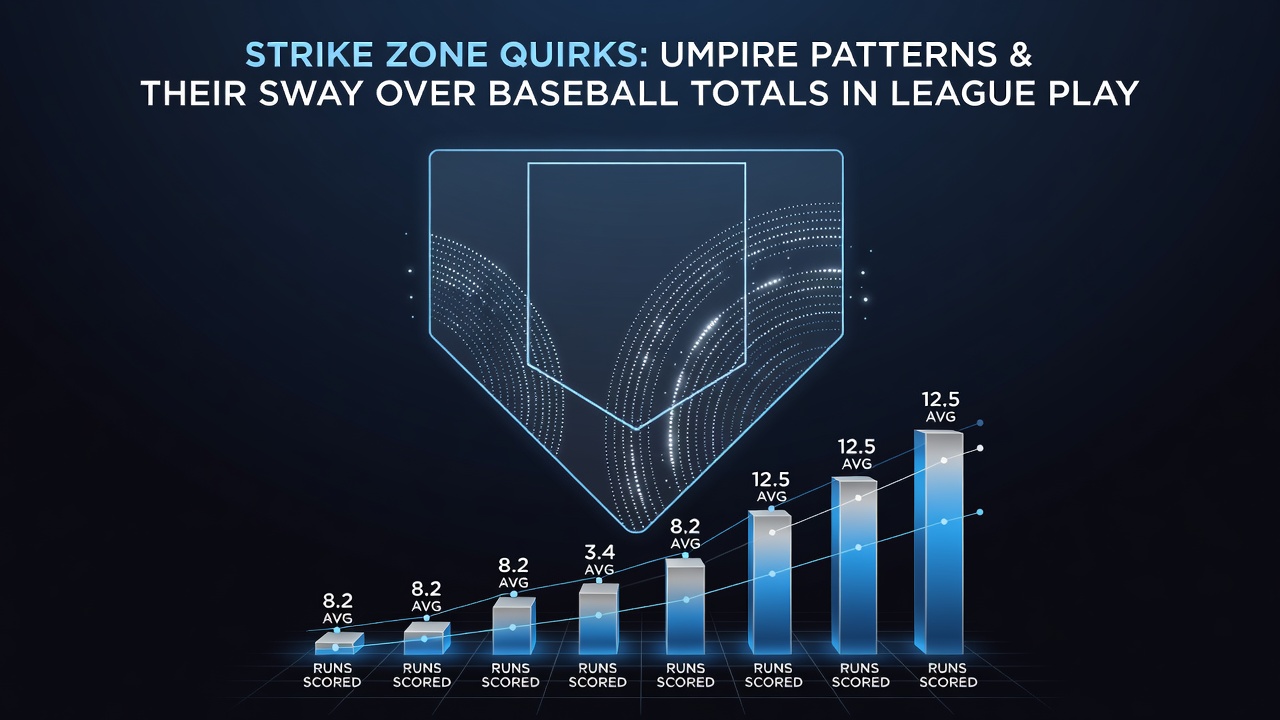
Strike Zone Quirks: Umpire Patterns and Their Sway Over Baseball Totals in League Play
Strike zones in baseball have long shown measurable differences across individual umpires, and these variations directly shape run totals in league games through their effects on called strikes, walks, and overall pitch counts. Researchers tracking pitch data have documented how certain officials maintain narrower zones that favor pitchers, while others expand the area in ways that increase hitter opportunities, and such distinctions accumulate over full seasons to influence betting markets on over-under totals.
Documented Variations in Umpire Strike Zones
League tracking systems record thousands of pitches each season, revealing that umpires consistently differ in how they interpret the vertical and horizontal boundaries of the strike zone. Some officials call strikes on pitches that clip the edges more frequently than others, and this pattern holds across multiple games and teams. Data from the 2025 season onward indicates that these discrepancies persist even after accounting for pitcher handedness and batter stance, while observers note similar trends continuing into June 2026 during interleague play.
One study released by the Society for American Baseball Research examined over 2.5 million pitches and found that the top 10 percent of umpires with the largest zones produced 8 percent more walks per game on average compared with those maintaining tighter interpretations. Such findings align with pitch-tracking outputs from multiple organizations, and the differences translate into measurable shifts in innings length and scoring opportunities.
How Zone Patterns Affect Run Production
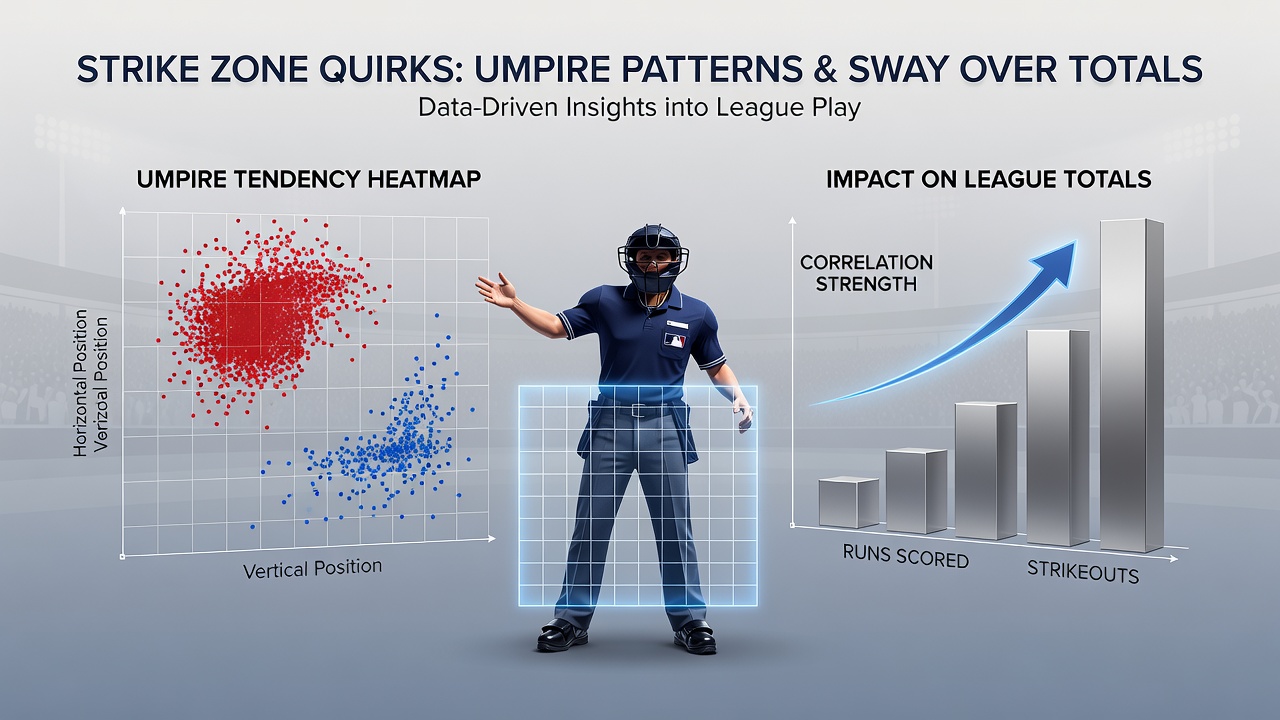
Expanded strike zones tend to suppress offense by generating more swinging strikes and called third strikes, which reduces baserunners and limits scoring sequences. Conversely, smaller zones lead to higher walk rates and extended at-bats that raise pitch counts and increase the likelihood of bullpen usage, both of which correlate with elevated run totals in later innings. League-wide figures show that games worked by umpires with documented larger zones finished with run averages 0.4 runs below the seasonal mean during the 2025 campaign.
These effects compound when multiple umpires with similar tendencies work consecutive series, and analysts tracking totals markets have observed corresponding adjustments in line movements. In June 2026, early-month data from the National League revealed that series featuring umpires from the wider-zone group posted under totals at a 53 percent rate, a figure consistent with historical patterns tracked since automated systems began logging every pitch location.
League-Specific Patterns and Rotation Schedules
Major League Baseball assigns umpires through a rotation system designed to balance exposure across teams, yet patterns still emerge because individual officials retain distinct tendencies regardless of assignment. American League games have shown slightly higher average totals when crews include umpires who favor lower zones, while National League contests reflect the opposite trend with crews featuring higher-zone officials. These league-level distinctions arise partly from differing designated hitter rules and their impact on lineup construction, which interacts with zone size to alter expected scoring.
Rotation schedules released each month allow observers to identify upcoming assignments, and historical performance data tied to those assignments provides context for totals expectations. In early June 2026, crews working West Coast series demonstrated zone consistency rates above 92 percent across multiple venues, according to pitch-tracking summaries published by league statisticians.
Tracking Tools and Available Data Sources
Modern pitch-tracking technology supplies granular location data that teams and analysts use to build umpire profiles, and public databases now include per-umpire metrics on zone size, called-strike percentage, and run expectancy impact. These resources draw from systems installed at every major league ballpark, and the resulting datasets span multiple seasons for comparative analysis. External reports such as those available through MLB official statistics portals aggregate these metrics alongside game logs, enabling side-by-side evaluation of totals outcomes under different officials.
Additional research compiled by institutions outside North America, including academic reviews from Australian sports analytics programs, has examined parallel patterns in international leagues where similar tracking tools operate. Such cross-regional comparisons confirm that umpire-driven zone variations influence scoring regardless of rule-set differences, though the magnitude of the effect scales with league-specific factors like ballpark dimensions and pitching styles.
Conclusion
Umpire strike zone patterns constitute a measurable factor in baseball totals markets because they alter pitch outcomes in consistent, documentable ways across seasons. Rotation schedules, pitch-tracking datasets, and league statistics together provide the factual foundation for understanding these influences, while June 2026 data continues to reflect the same relationships observed in prior years. Continued refinement of tracking systems promises even more precise mapping of these effects as additional games accumulate.